M WANG Lab

Human genetics

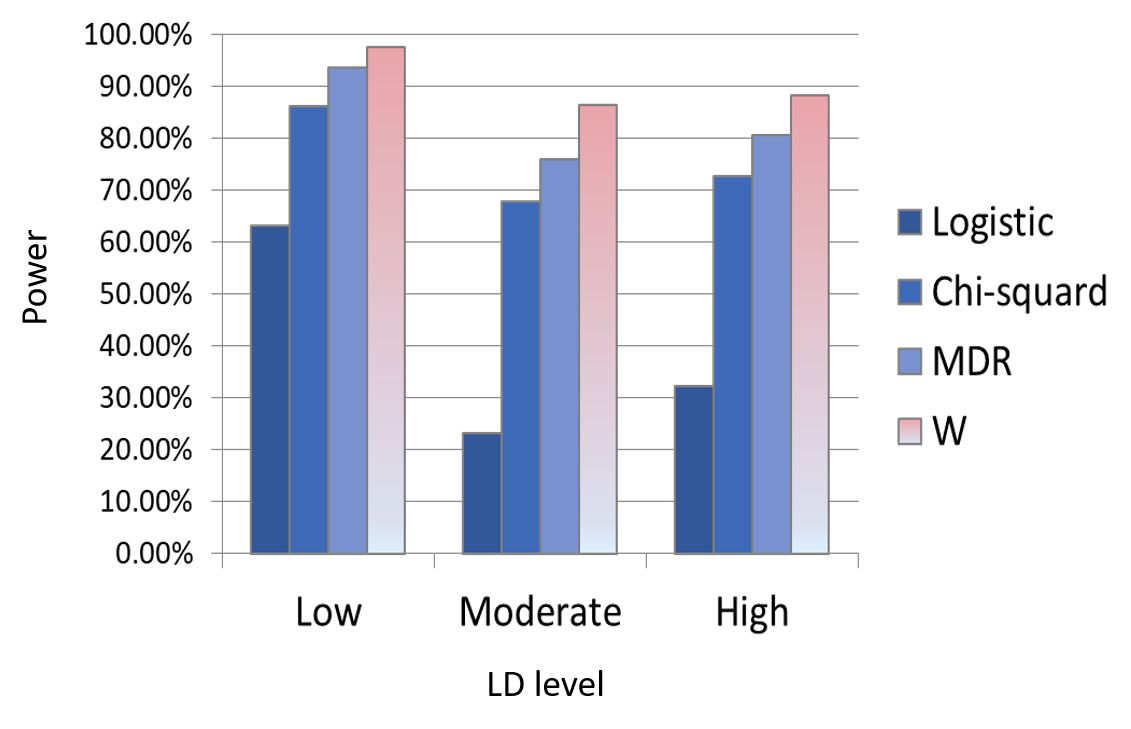
Wang MH, Sun R, Guo J, Weng H, Lee J, Hu I, Sham PC, Zee BC. A fast and powerful W-test for pairwise epistasis testing. Nucleic acids research. 2016 Jul 8;44(12):e115-.https://doi.org/10.1093/nar/gkw347
Sun R, Weng H, Wang MH*. W-Test for Genetic Epistasis Testing. Methods In Molecular Biology. 2021; 45-53.
Sun R, Weng H, Hu I, Guo J, Wu WK, Zee BC, Wang MH*. A W-test collapsing method for rare variant association testing in exome sequencing data. Genetic Epidemiology. 2016 Nov;40(7):591-6.
Sun R, Weng H, Xia X, Chong K, Zee BC, Wang MH*. Gene-methylation epistasis analysis by a W-test identified enriched signals of neuronal genes in patients undergone lipid control treatment. BMC Proceedings
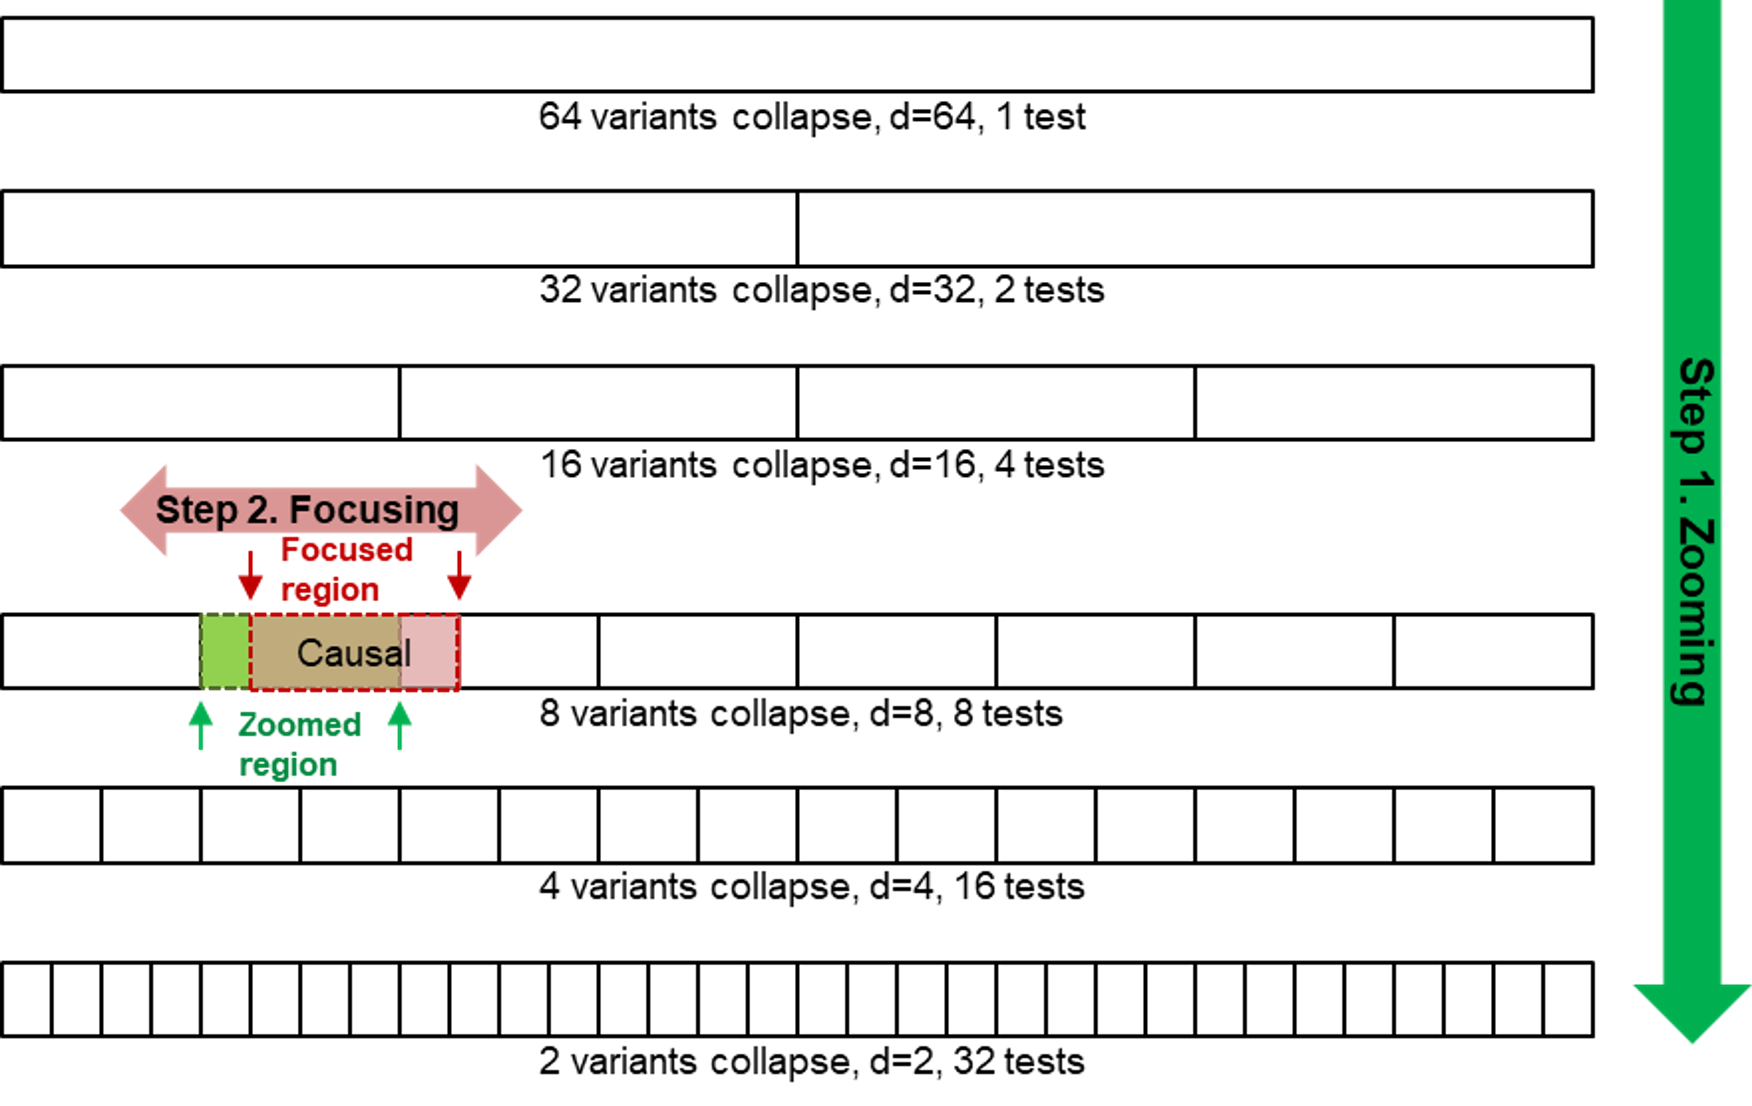
The method was inspired from stargazing using a telescope: first a grid-search in sky is performed with an eye-piece to identify rough position of a target planet, and then the observer adjusts focal length of telescope to get a high resolution view of the target. Looking for informative loci in deep sequencing genome could be similar.
Wang MH, Weng H, Sun R, Lee J, Wu WK, Chong KC, Zee BC. A Zoom-Focus algorithm (ZFA) to locate the optimal testing region for rare variant association tests. Bioinformatics. 2017 Aug 1;33(15):2330-6.
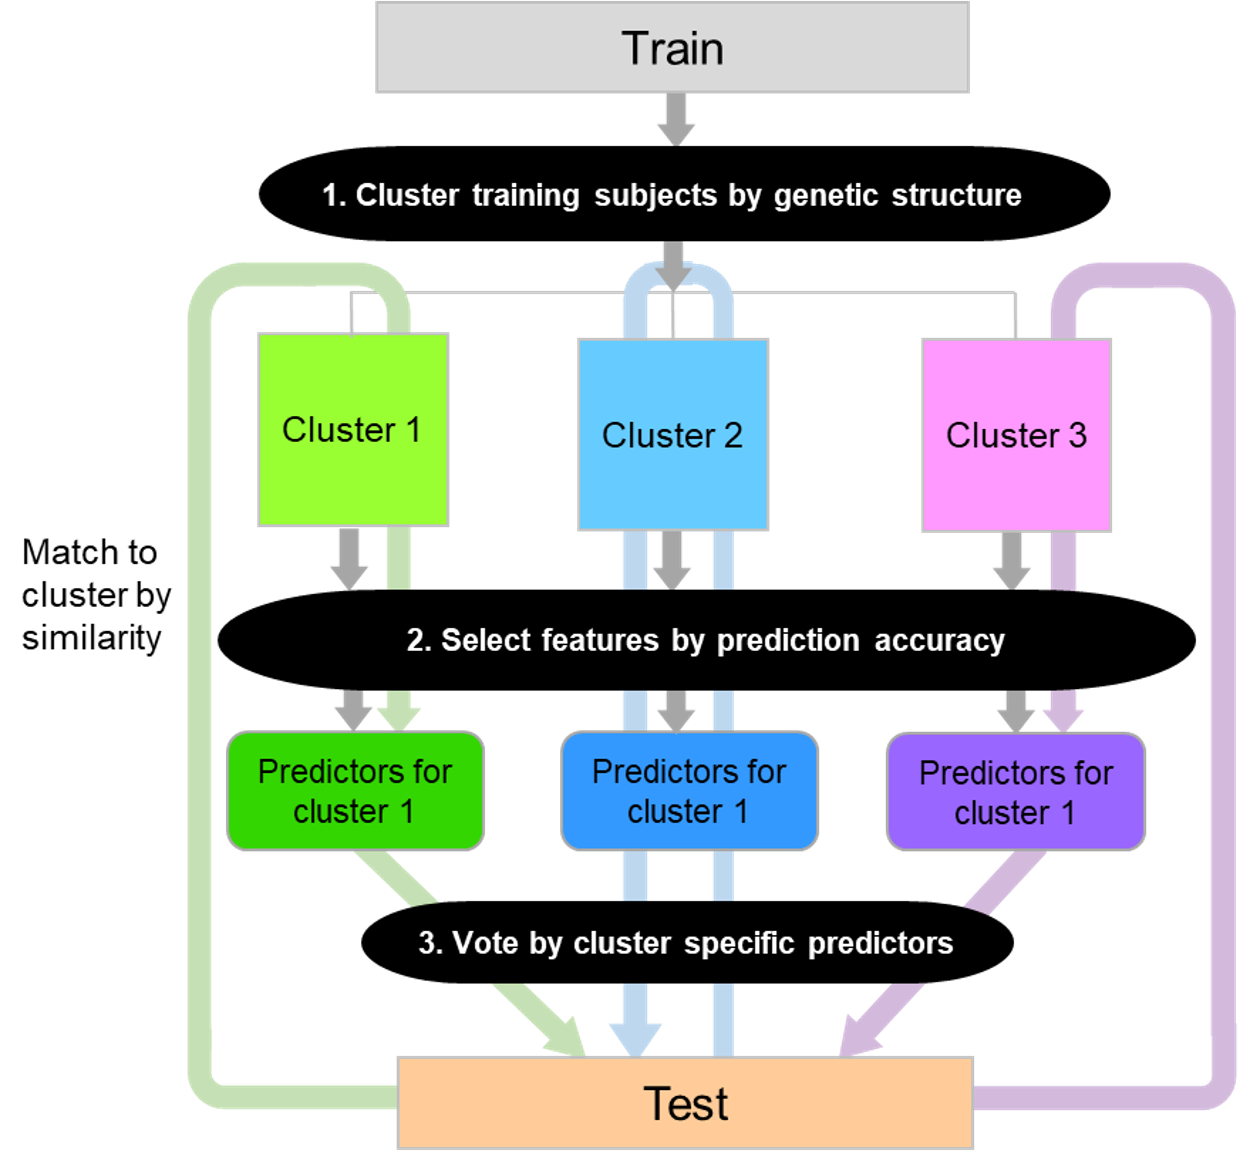
2019 US Provisional Patent No. 62/915,459, 19/MED/902, filed on 15 October 2019, Prediction Models Incorporating Stratification of Data.Wang MH, Xia X, Zee BCY.
Xia X, Zhang Y, Sun R, Wei Y, Li Q, Chong MKC, Wu WKK, Zee BCY, Tang H, Wang MH* (2022) A Prism Vote Method for Individualized Risk Prediction of Traits in Genotype Data of Multi-population, PLOS Genetics. Accepted
Xia X, Weng H, Sun R, Chong K, Zee BC*, Wang MH* Incorporating methylation genome information improves prediction accuracy for drug treatment responses. BMC Genetics. 2018 Sep;19(1):78.
Wang MH, Lo SH, Zheng T and Hu I (2012) A Classification Method Incorporating Interactions among Variables for High-dimensional Data. Bioinformatics (2012) 28 (21): 2834-2842
Wang MH, Chong K, Chung H, Storer M, Pickering J, Endre Z, Lau S, Kwok C, Lai M, Zee BC. Use of a Least Absolute Shrinkage and Selection Operator (LASSO) Model to Selected Ion Flow Tube Mass Spectrometry (SIFT-MS) Analysis of Exhaled Breath to Predict the Efficacy of Dialysis. Journal of Breath Research. 2016 Sep 28;10(4):046004.
Wang MH, Lau SY, Kwok C, Chong K, Lai M, Chung AH, Ho C, Szeto C, Zee BC. Estimation of clinical parameters of chronic kidney disease (CKD) by exhaled breath full-scan mass spectrometry data and Iterative PCA with Intensity Screening (IPS) algorithm. Journal of Breath Research. 2017 Aug 21;11(3):036007.
Statistical methods for disease risk prediction with genotype data, with Xia X, Zhang Y, Wei Y. To appear. Springer Nature. 2022-
"Genetic Test, Risk Prediction Model, and Genetic Counselling", with Haoyi Weng, Book Title: Translational Informatics in Smart Healthcare, Springer, 2017